On the TI-84 Evo's graph screen, press + to zoom in and − to zoom out.
Zoom in and out with + and −
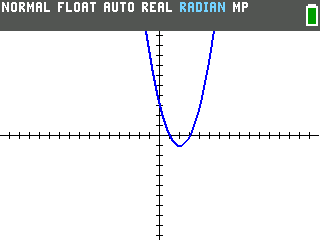
Here's the graph of Y1 = X² − 4X + 3 in the window the calculator starts with. The bottom of this parabola is small and hard to read. (New to graphing? Graphing a function on the TI-84 Evo covers typing it in.)
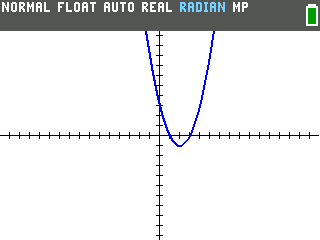
To zoom in, start by moving your cursor to the area you want to zoom into, then press +.
- Hold the right arrow, then the down arrow. A cursor appears in the middle of the screen
and moves with the arrows. Stop when it sits on the bottom of the curve, at X=2 and Y=−1.
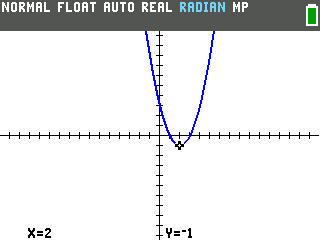
- Press
+. The graph zooms in around the cursor, so the bottom of the curve moves to the middle of the screen at twice the size.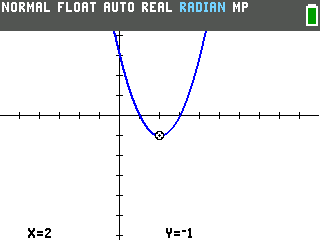
- Press
+again to get closer. Now you can see where the curve dips below the x-axis and crosses back up.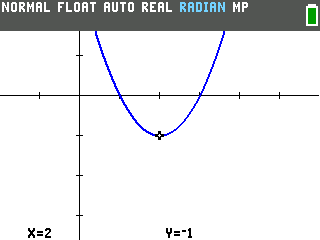
- To zoom back out, press
−. That's the subtract key. It zooms out around the cursor by the same amount.
With no cursor on the screen, + and − zoom around the middle of the screen instead. Pressing
clear on the graph hides the cursor.
If + doesn't zoom like it does here, you need to update your calculator's operating system. Here's how to install the newest operating system.
Start over with Zoom Default
If you want to reset back to the default zoom, use Zoom Default. It puts back the window the calculator starts with.
- Press
zoom. It's the middle key of the top row.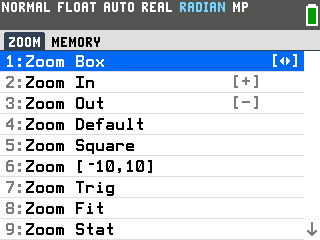
- Scroll down to Zoom Default and select it. The graph redraws the way it looked at the top of this page.
Resetting the graphing window has more on getting a clean graph back.
Zoom in exactly with Zoom Box
If you want to zoom into a precise area of the screen, use Zoom Box. You draw a box around the part you want, and that part fills the screen.
- Press
zoom, then select Zoom Box. A cursor appears in the middle of the graph. - Move the cursor to one corner of your box: hold the right arrow, then the up arrow.
Here it goes above and to the left of the bottom of the curve.
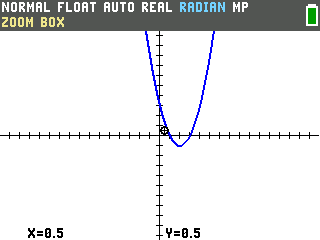
- To pin that corner, press
enter. - Stretch the box to the opposite corner: hold the right arrow, then the down arrow. The box
stretches as the cursor moves.
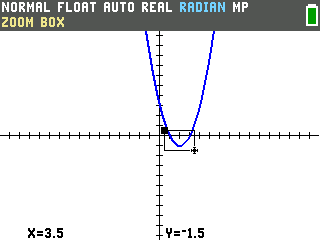
- To zoom in on the box, press
enter. The graph redraws with only what was inside it.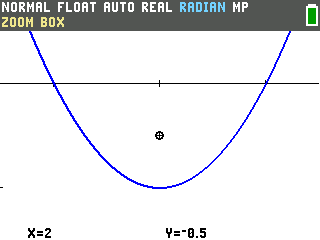
The cursor and the ZOOM BOX label stay on the graph until you press clear.
Undo a zoom
If you want to undo a zoom, use Zoom Previous. It takes the graph back one zoom, whether that zoom came from the menu or the + key.
- Press
zoom, then the right arrow. That opens the MEMORY tab, with Zoom Previous at the top.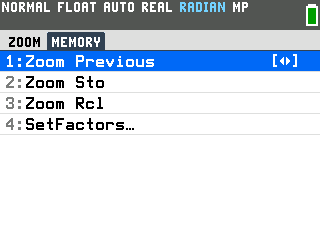
- Select Zoom Previous. The graph goes back to how it looked before the box.
The rest of the ZOOM menu
Each of these changes the window as soon as you select it.
- Zoom Square makes one unit along x the same length on the screen as one unit along y, so a circle looks round. The starting window already has equal units, so you'll only see a change after a zoom like Zoom [−10,10].
- Zoom [−10,10] runs both axes from −10 to 10.
- Zoom Trig sizes the window for sine and cosine graphs, as shown in graphing trig functions.
- Zoom Fit keeps the left and right edges and moves the top and bottom until the part of the curve between those edges fits on the screen.
- Zoom Stat fits the window around the points of a stat plot, as in plotting points.
- Zoom Quadrant1 moves the axes to the bottom-left corner, so the screen shows mostly positive x and y.
To type exact edges in yourself, see adjusting the graphing window.