To do quadratic regression on the TI-84 Evo, put your x-values in L1 and your y-values in L2, then run QuadReg from the STAT menu's CALC tab. It gives you a, b and c for y = ax² + bx + c, plus R².
As an example, here's a ball tossed into the air, with its height measured once a second:
| Time, seconds (x) | 0 | 1 | 2 | 3 | 4 |
|---|---|---|---|---|---|
| Height, feet (y) | 4 | 55 | 69 | 51 | 6 |
Enter the data
- Press
stat, thenenter. That opens the list editor, where each column is a list. The x-values go in L1 and the y-values in L2. If L1 or L2 already has numbers in it, empty it first: arrow up onto the list's name, pressclear, thenenter. - Type the x-values down L1, pressing
enterafter each one. Here that's 0, 1, 2, 3 and 4. - Press the right arrow and type the y-values down L2. Here that's 4, 55, 69, 51 and 6,
with
enterafter each. Every y-value should sit in the same row as its x-value.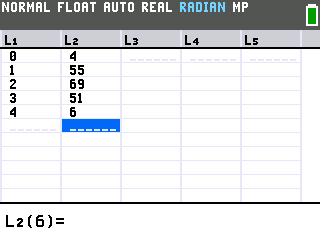
Run QuadReg
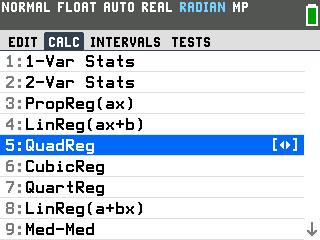
- Press
stat, then the right arrow. That opens the CALC tab, which holds all the regressions. - Press the down arrow until QuadReg is highlighted.
- Press
enter. A setup screen opens with XLIST on L1 and YLIST on L2, so the lists are already right.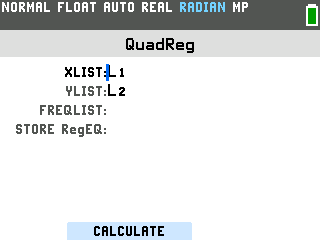
- If you'd like to graph the parabola later, press the down arrow until the cursor reaches STORE RegEQ. The next two steps save the equation in Y1. If you only need the numbers, skip to the last step.
- Press
alpha, thentrace. A shortcut menu opens with Y1 at the top.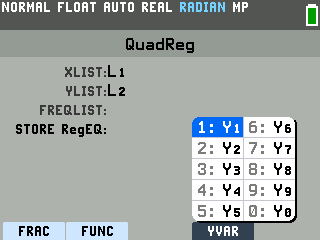
- Press
enter. STORE RegEQ now reads Y1.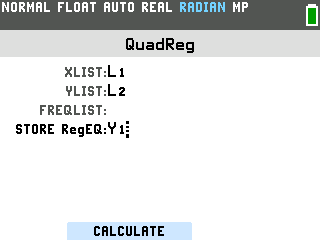
- Press
zoom. The CALCULATE button at the bottom of the screen sits right above the zoom key, and pressing that key runs the regression. Pressingenterhere only moves the cursor.
Read the results
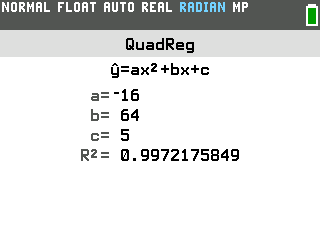
- a, b and c go into y = ax² + bx + c. Here a = −16, b = 64 and c = 5, so the equation is y = −16x² + 64x + 5.
- R² measures the fit. It runs from 0 to 1, and the closer it is to 1, the closer the curve passes to your points. Here it's about 0.997, a very close fit.
- No R² on your screen? Diagnostics is turned off. Press
mode, arrow down to DIAGNOSTICS ON, and pressenter. Then run QuadReg again.
Graph the parabola
This part uses the equation you saved in Y1 at the STORE RegEQ step. Skipped it? Run QuadReg again with Y1 in STORE RegEQ.
- Press
zoom. The ZOOM menu opens. - Press the down arrow until Zoom Fit is highlighted, then press
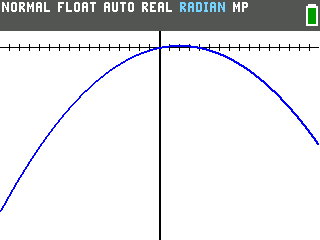
enter. Zoom Fit stretches the window to fit the curve.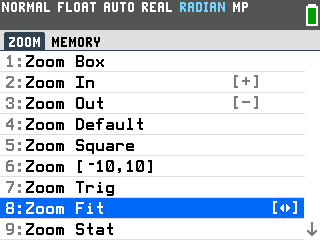
Add your data points
If you want to see your data points too, turn on a stat plot.
- Press
2nd, theny=. That opens the STAT PLOTS menu.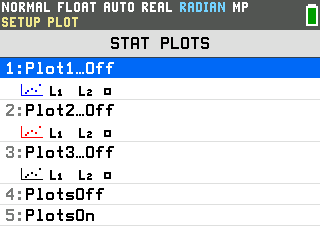
- Press
enterto open Plot1, thenenteragain to turn it On. It's already set to a scatter plot of L1 and L2.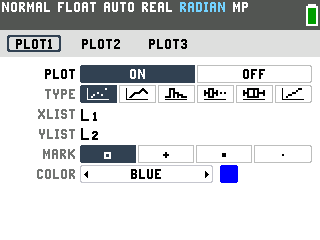
- Press
zoom, then9for Zoom Stat. Zoom Stat fits the window to your data, so the points show with the parabola running through them.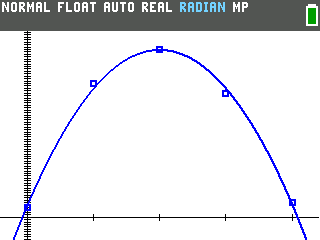
Good to know
- Use Y1 to predict. On the home screen, press
alpha,trace,enterto paste Y1, then type(and the x-value, and pressenter. Y1(1.5) gives 65, the height after 1.5 seconds. More on this in evaluating functions on the TI-84 Evo.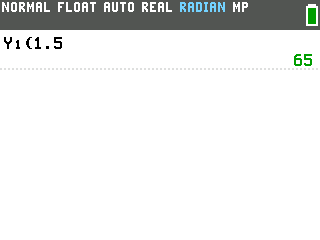
- Changed the data? Run QuadReg again. The results don't update on their own. The STORE RegEQ field starts empty every time you open QuadReg, so set it to Y1 again if you want the graph updated too.
- CubicReg and QuartReg work the same way. They sit right below QuadReg in the CALC tab and use the same setup screen.
- Data that looks like a straight line? Use linear regression instead.